This is a demonstration of a control system model of an outfielder catching fly balls. The fielder -- the light blue dot on the field grid -- catches the ball-- the red dot -- by controlling the vertical and lateral velocity of the optical projection of the ball on the retina. The fielder controls these variables by running toward or away from the ball, as necessary, to keep vertical velocity increasing, and to the left or right of the ball, to keep lateral velocity at zero. The three dimensional display show the changing position of the fielder and ball during a catch. The plot in the top right panel -- the Retinal View -- shows the optical path of the ball in the fielder's visual field; the location of the ball is plotted relative to home plate. The plot in the bottom right panel shows the rate at which the fielder is running from the time the ball is hit until the ball is caught; the fielder starts slow, reaches a peak velocity and then slows down to catch the ball.
Each press of the "New Run" button launches a new fly ball. The same fly ball can be repeated by pressing the "Replay" button. The field grid can be grabbed and rotated to get differnet perspectives on the catch.
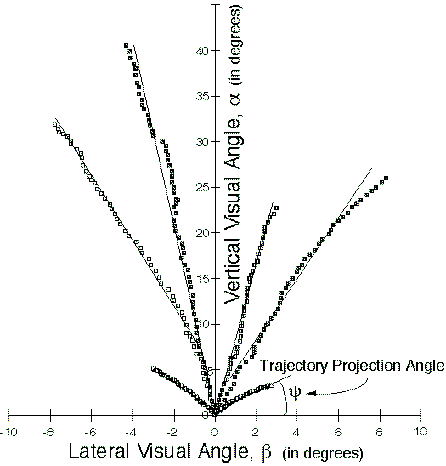
Compare the "Retinal" plots obtained in this simulation to equivalent "Retinal" plots obtained by McBeath, Shaffer and Kaiser (reported in Science, 1995, v. 268, pp. 569-573, Figure 4.) using a shoulder mounted video camera on a real fielder catching fly balls (below).
Also compare fielder's path, looking from the top of the 3-D display to the real fielder's path shown in the "Top View" plot below (also from the McBeath, et al article. Note that the simulated fielder sometimes backs up more than the real fielder but the lack of backing up by the real fielders may be a result of the particular fly ball trajectories used in the McBeath et al study and/or a result of the real fielders ability to use head movements to control the retinal variables.

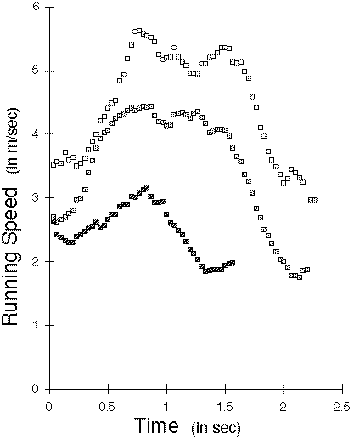
Finally, compare the "Running Rate" plot in the lower right panel to real running rates (collected by Dennis Shaffer and reported at his Web site: http://www.personal.kent.edu/~dshaffer/Outfielder.html.
Last Modified: March 20, 2014
MindReadings
Richard S. Marken